Dashboards and Visualizations#
Viewing Dashboard#
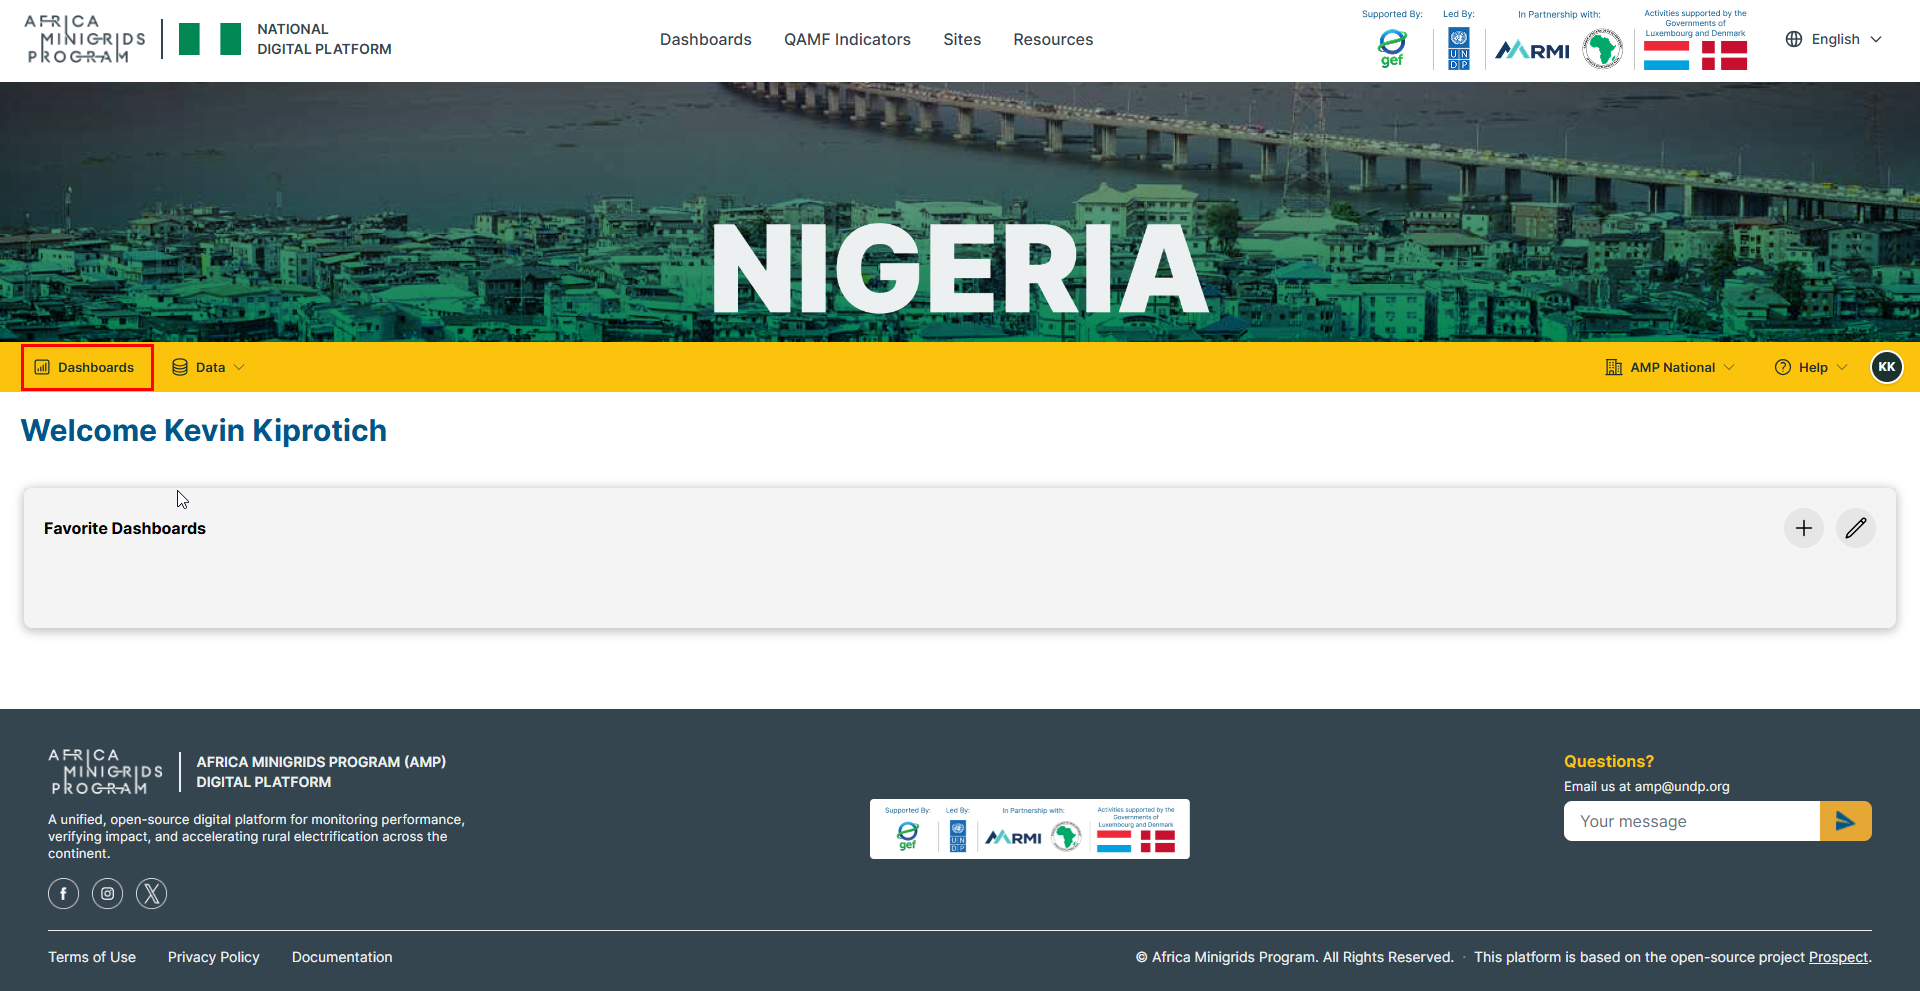
On the home page, click
Dashboardsto open the analytics page.
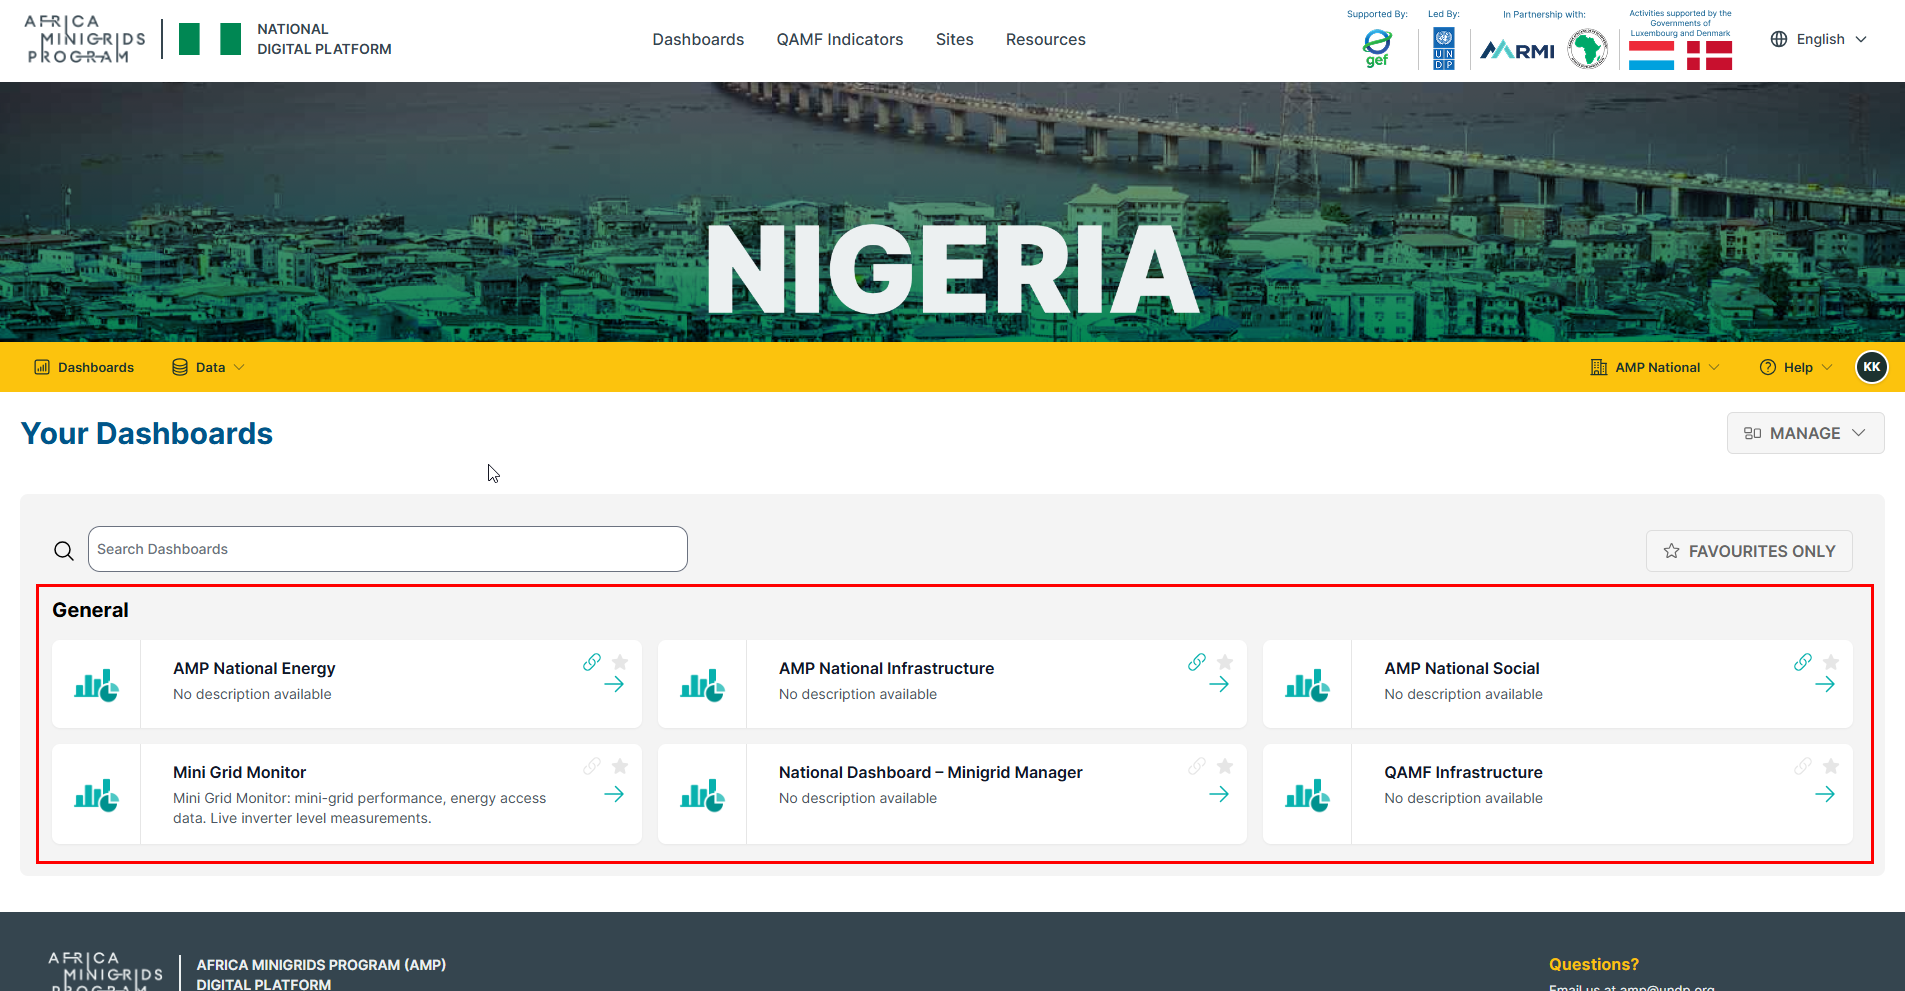
Select the dashboard that you wish to view.
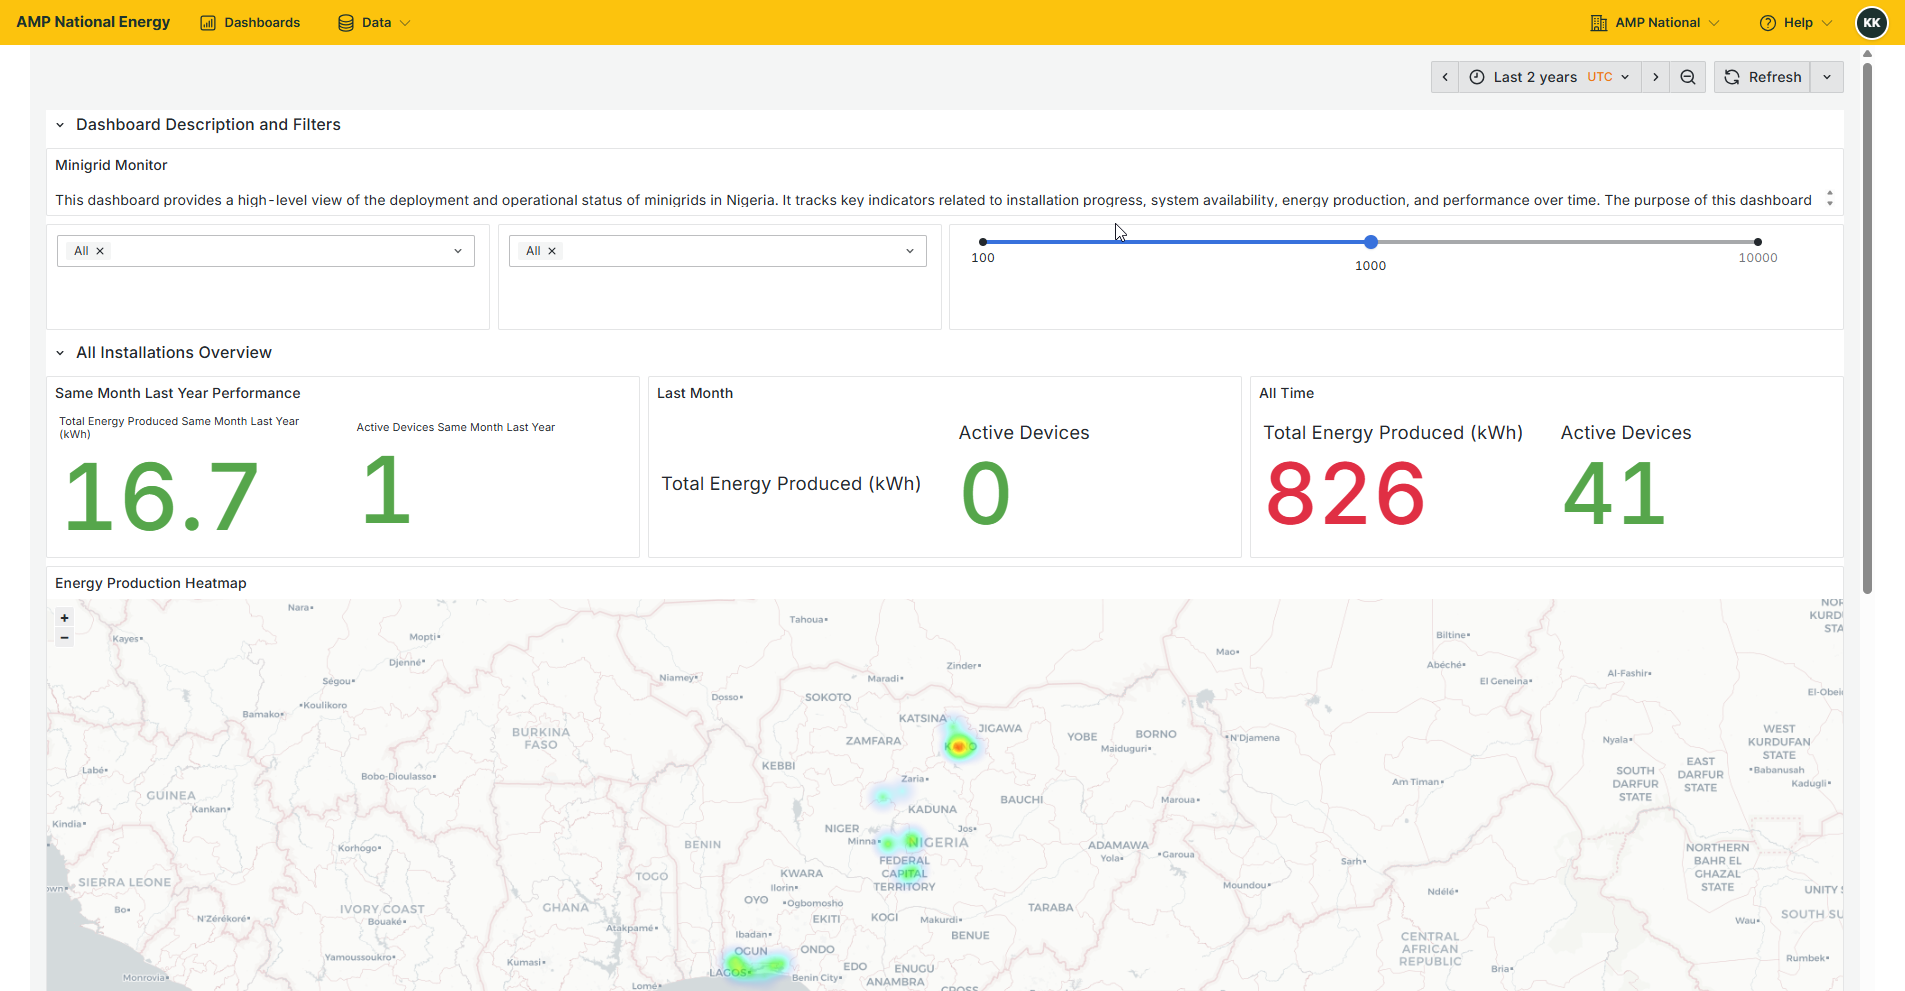
Your selected dashboard will be opened for you to view.
Creating a Dashboard#
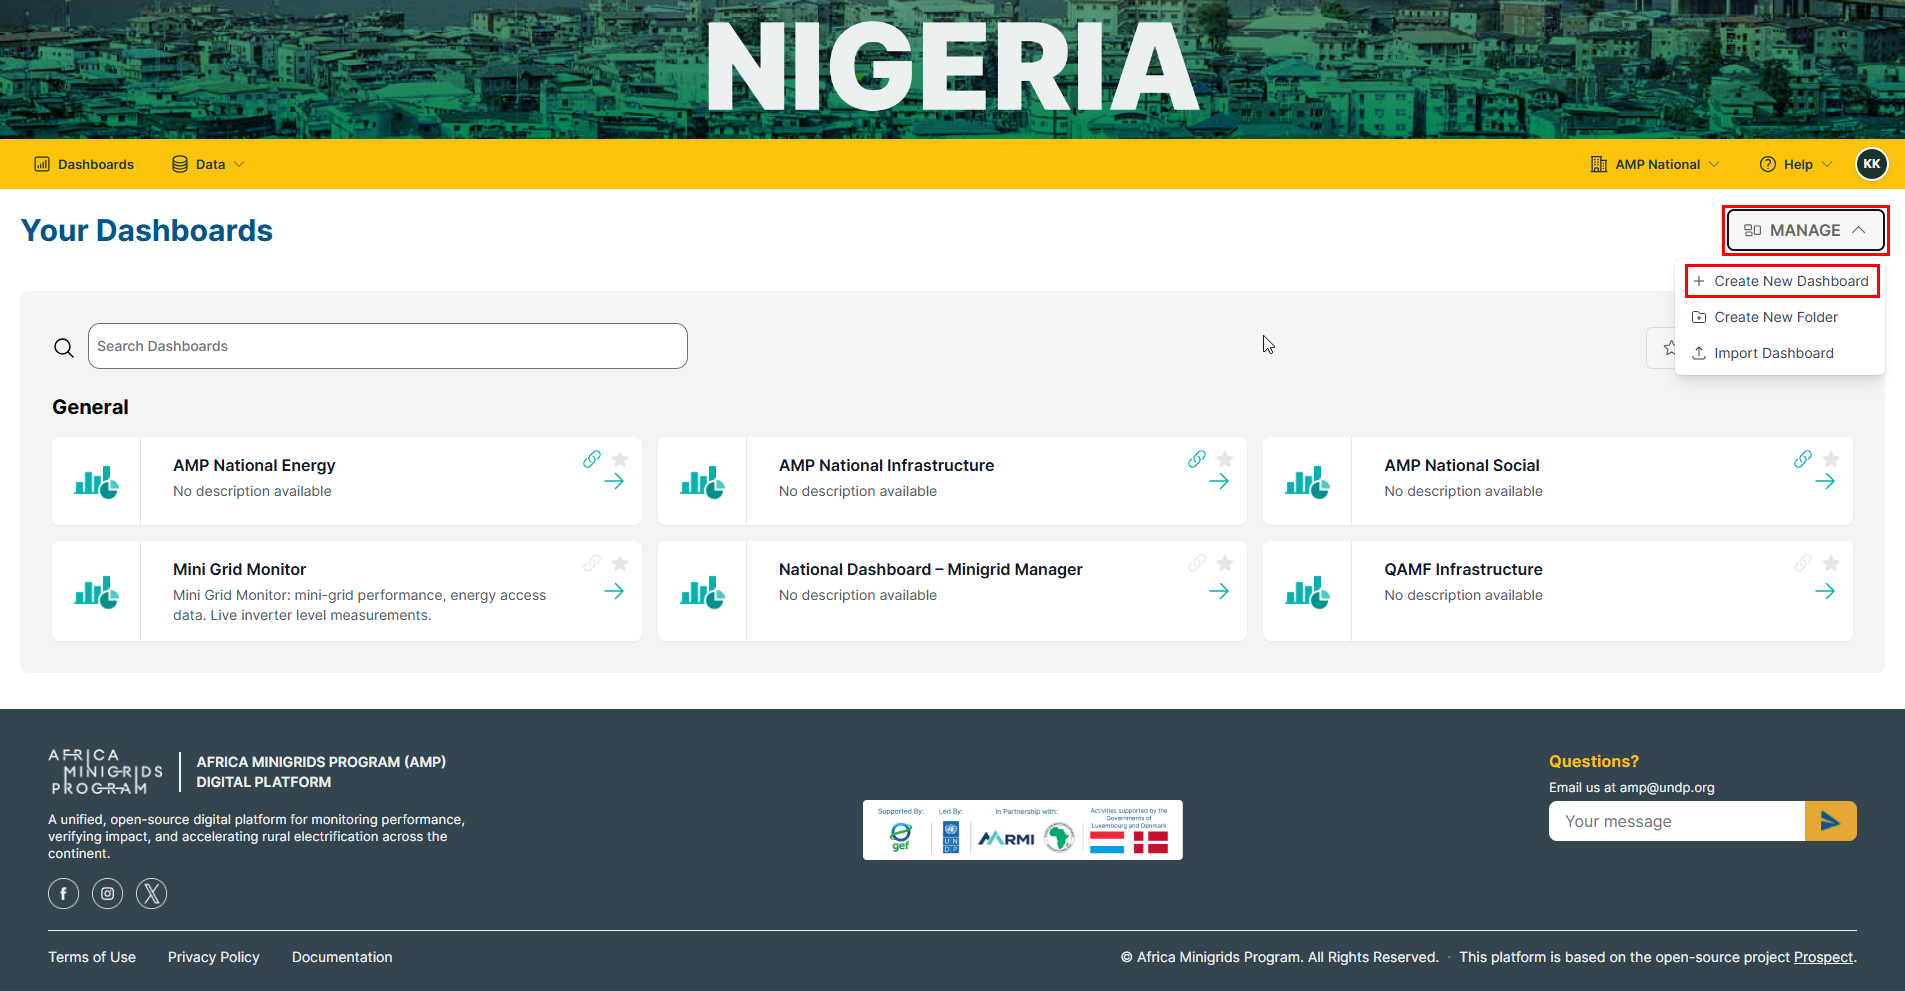
On the homepage, click
Dashboardsto open the analytics page
Click
MANAGEand select+ Create New Dashboard.
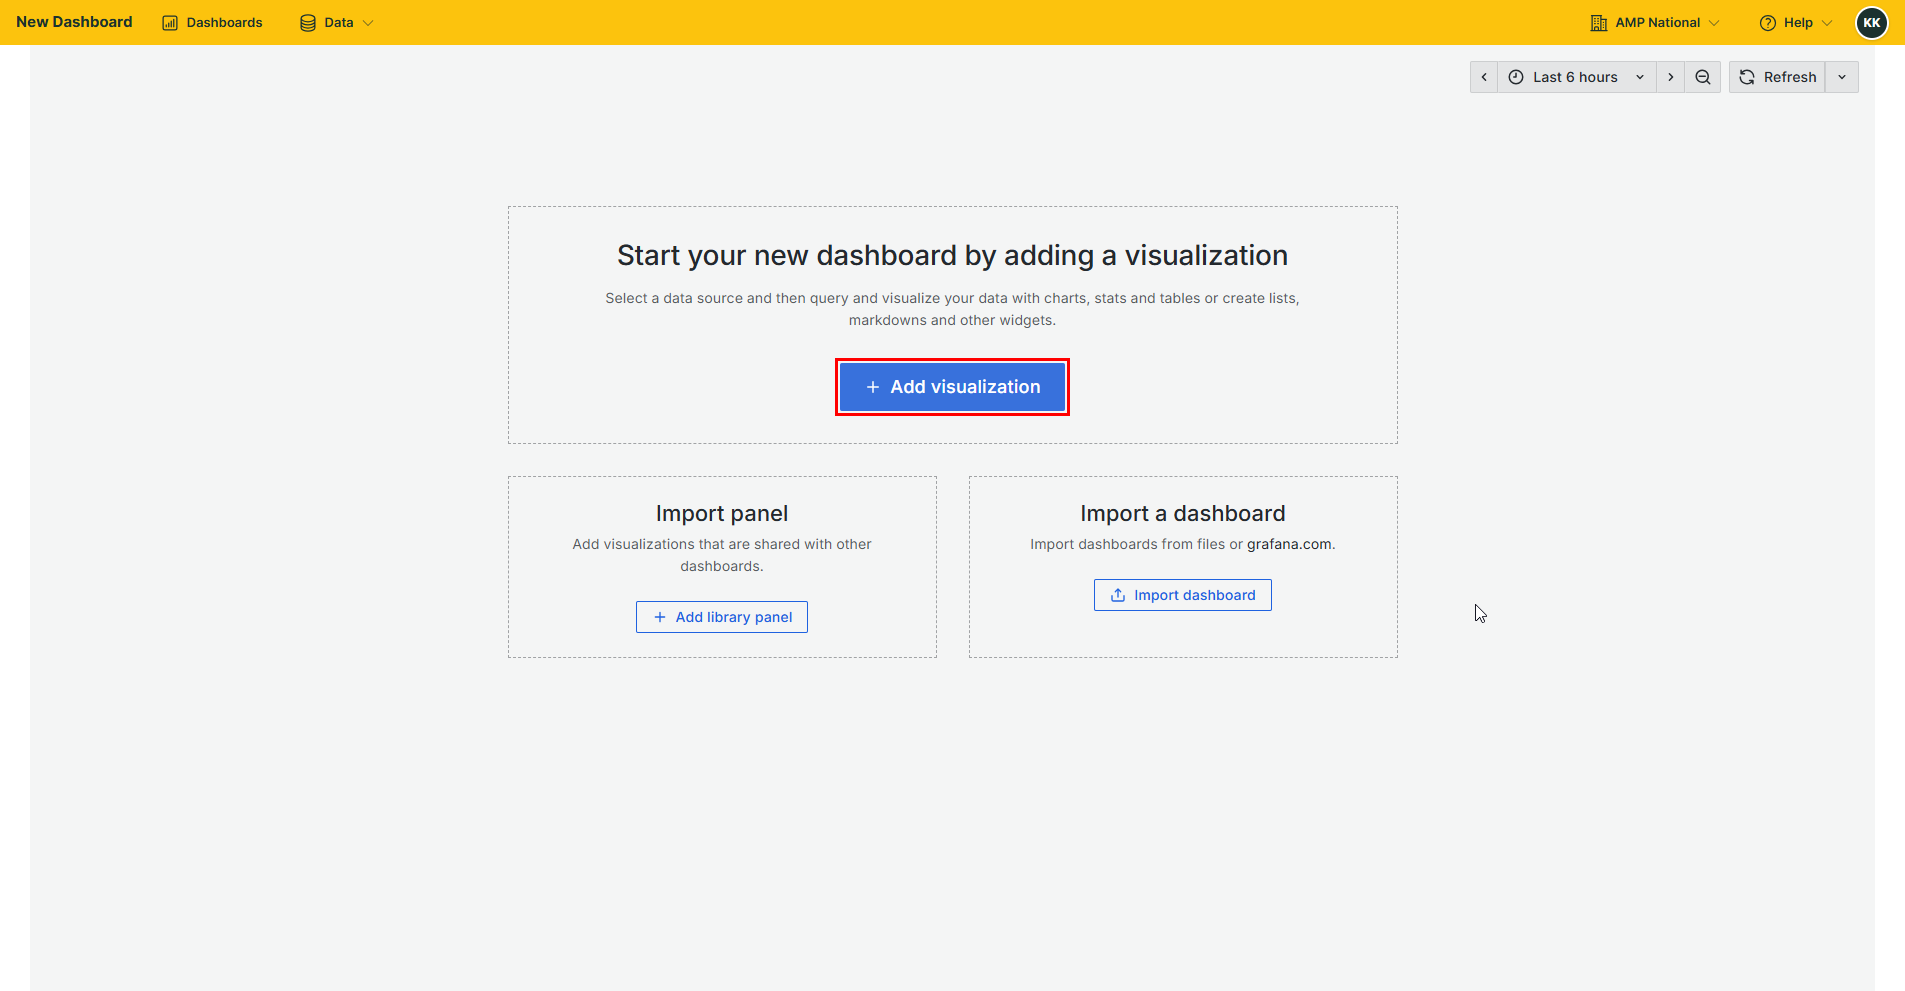
Click
Add Visualization
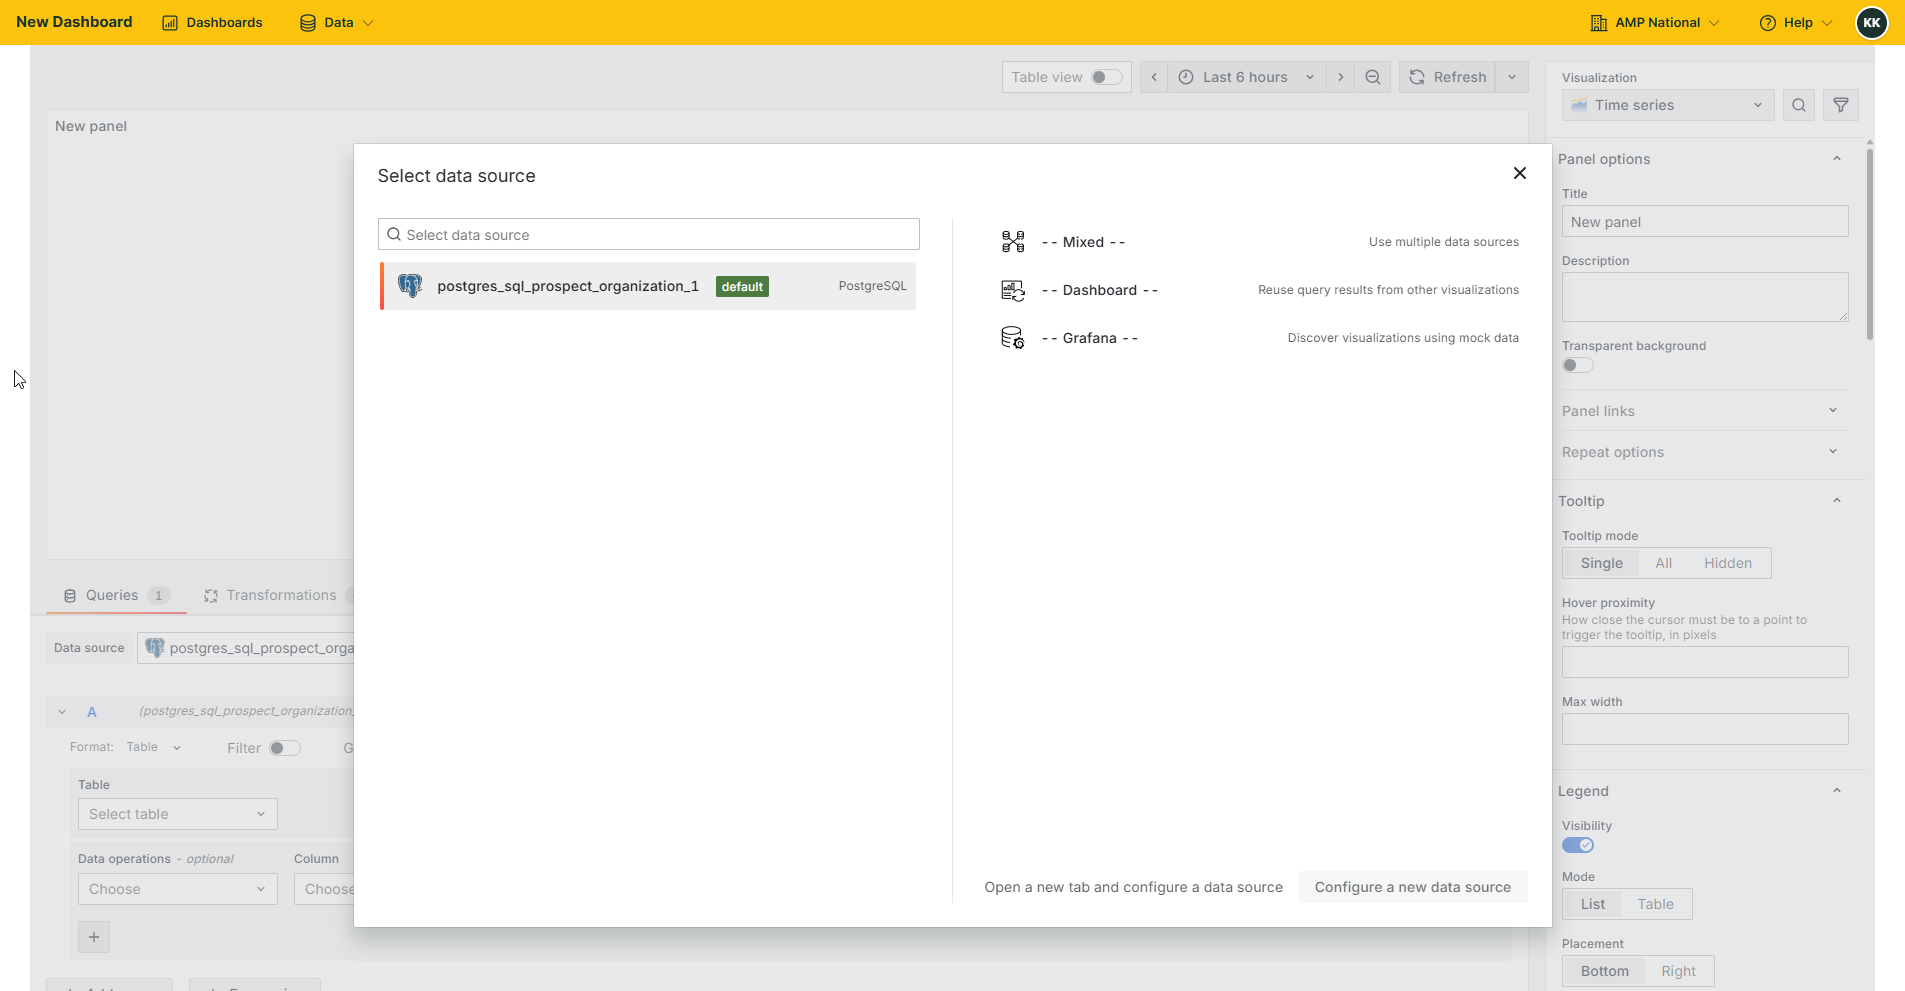
Select a data source.
From the data source, select a table.
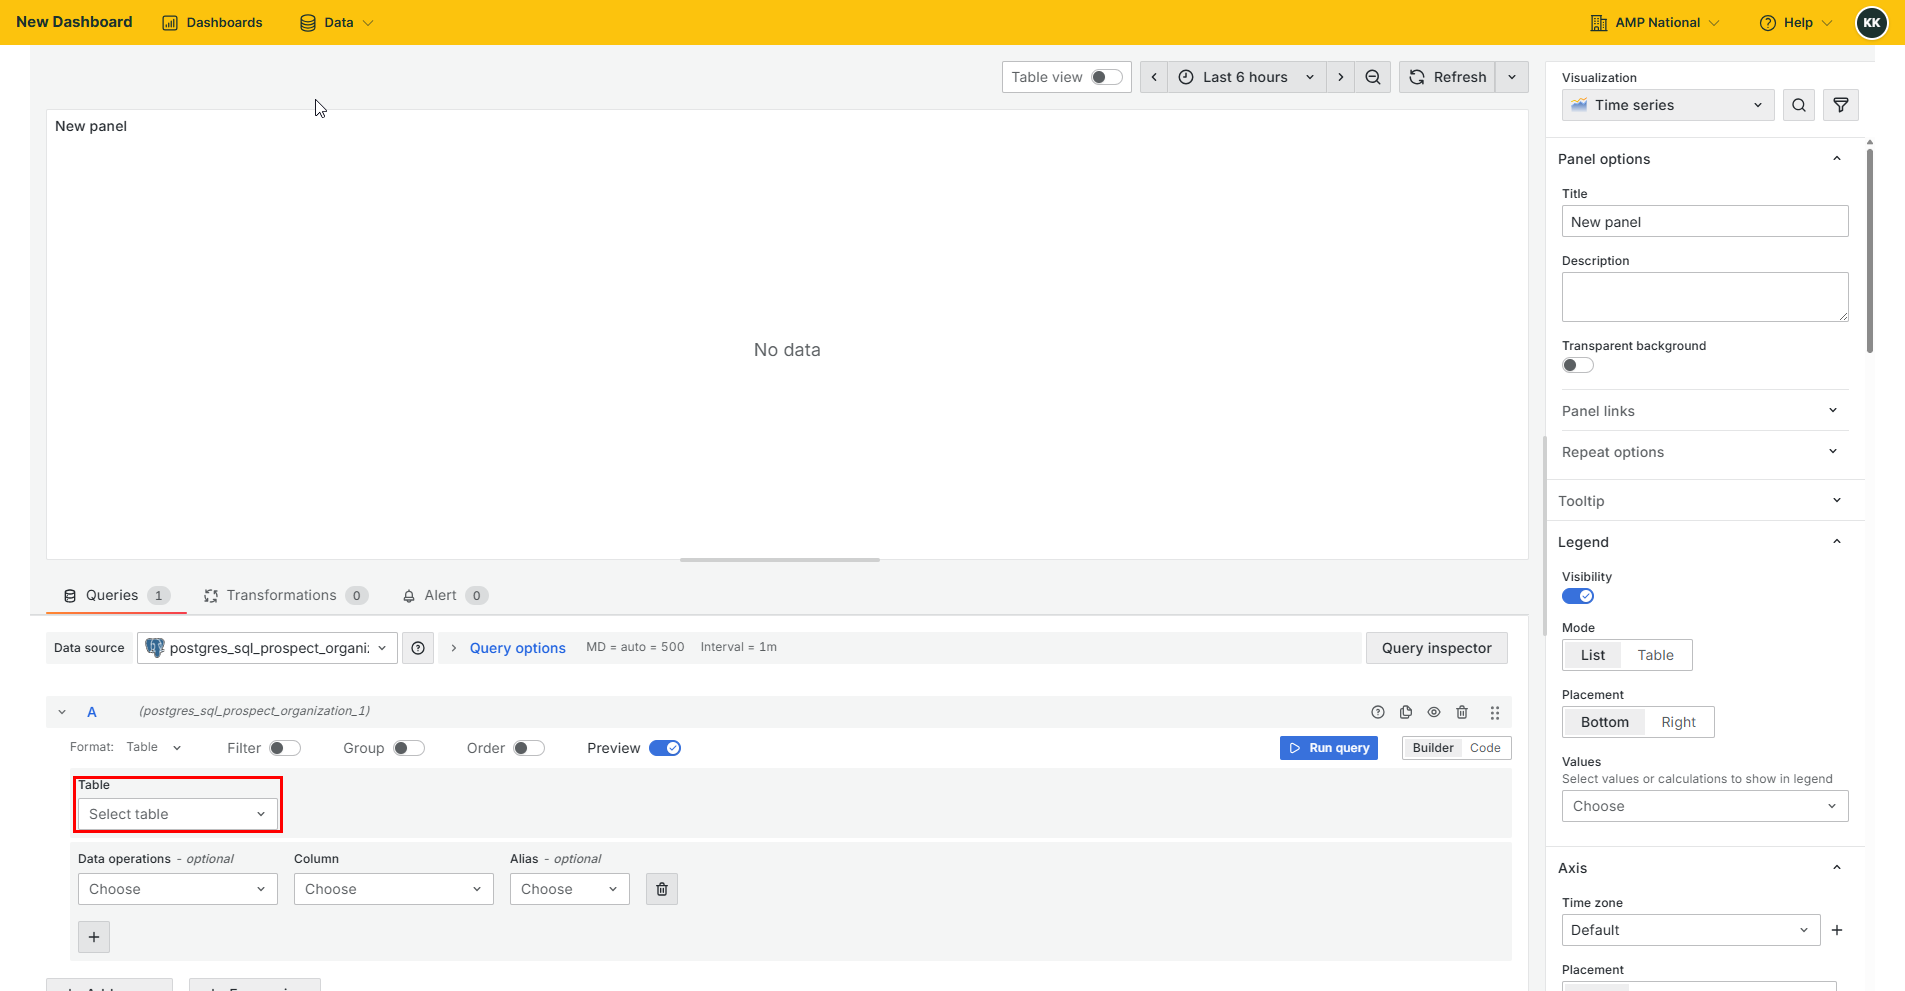
Select an appropriate visualization top be added as a panel to the dashboard.
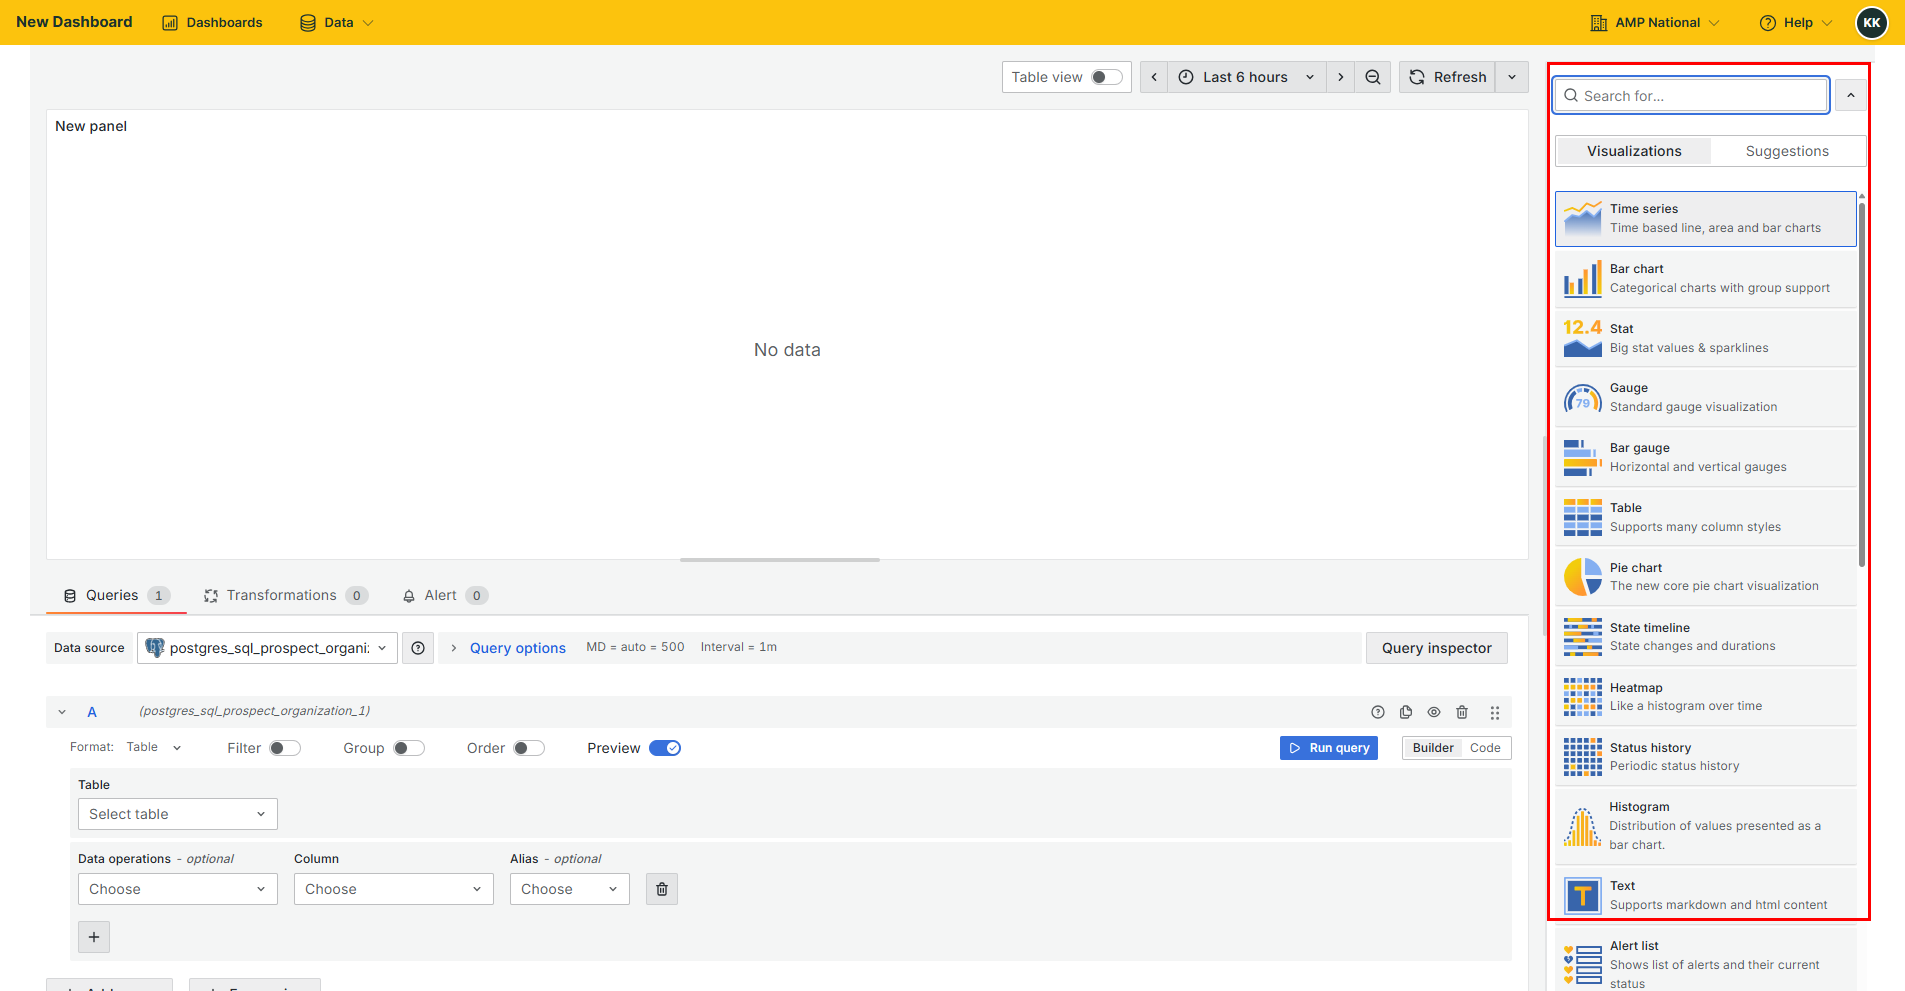
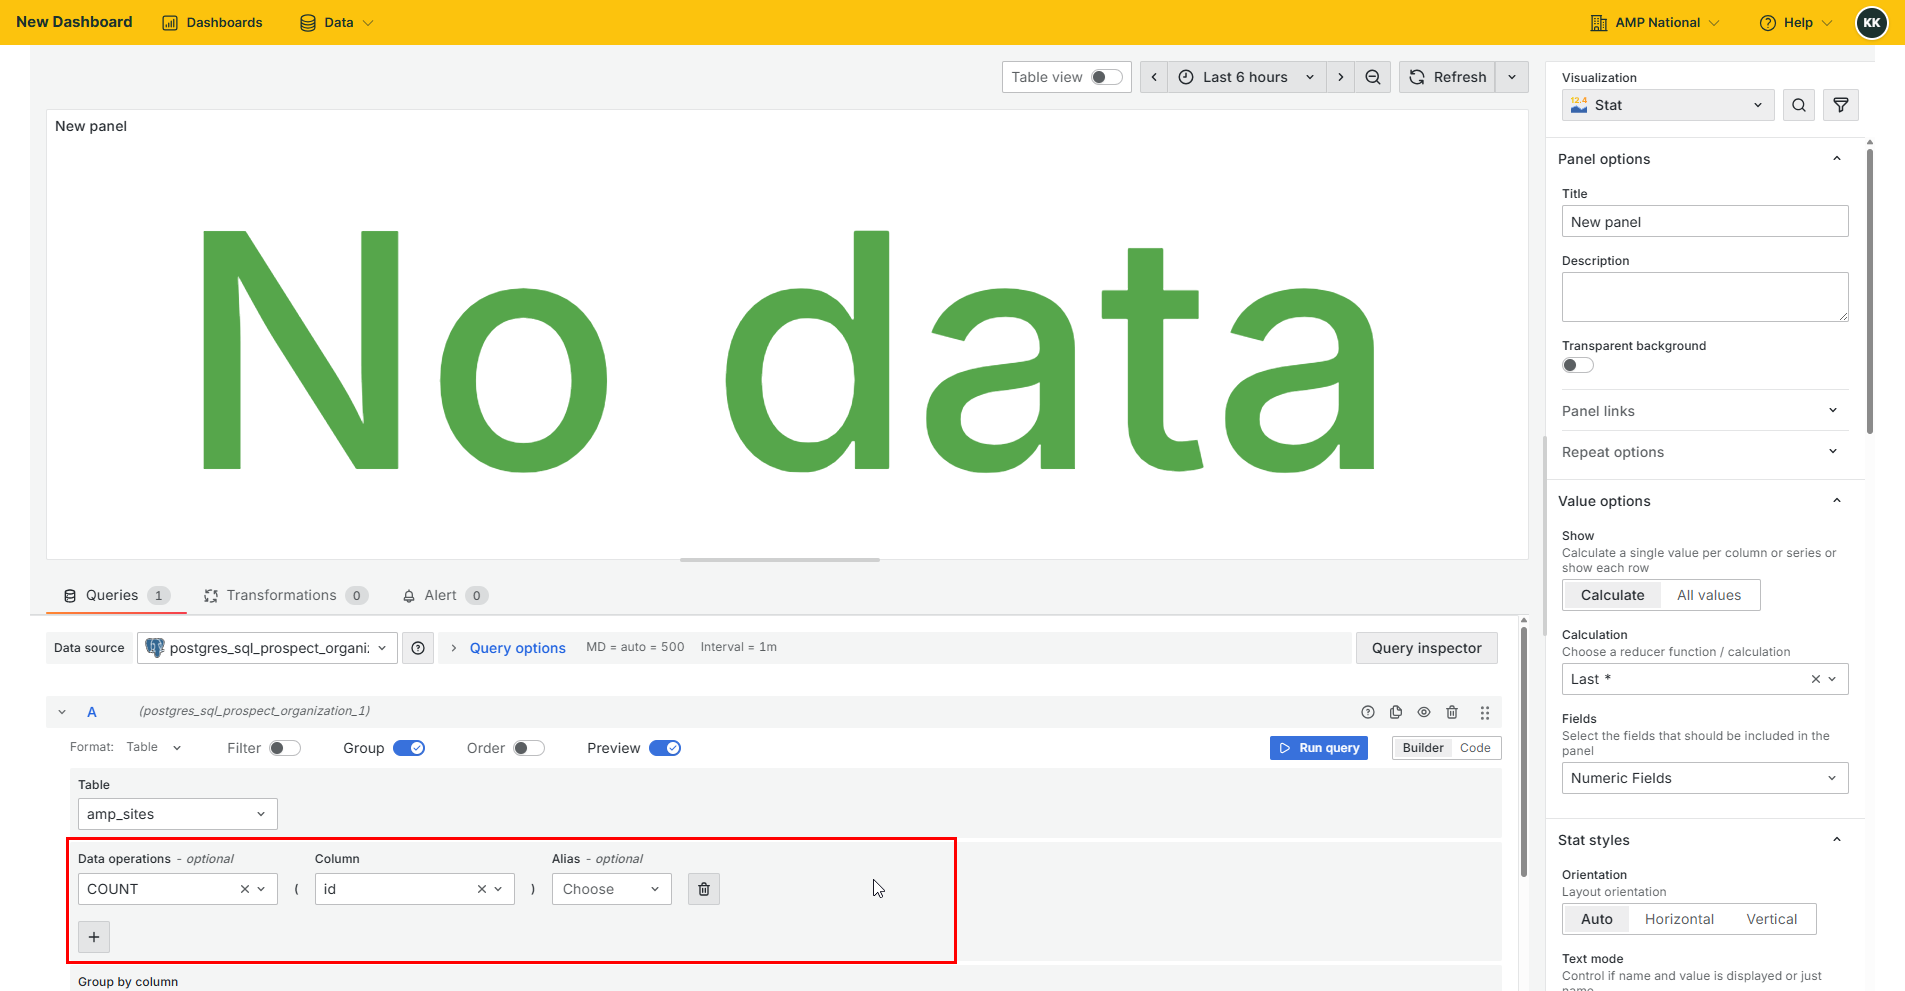
Perform the neccessary data operations for the selected visualization.
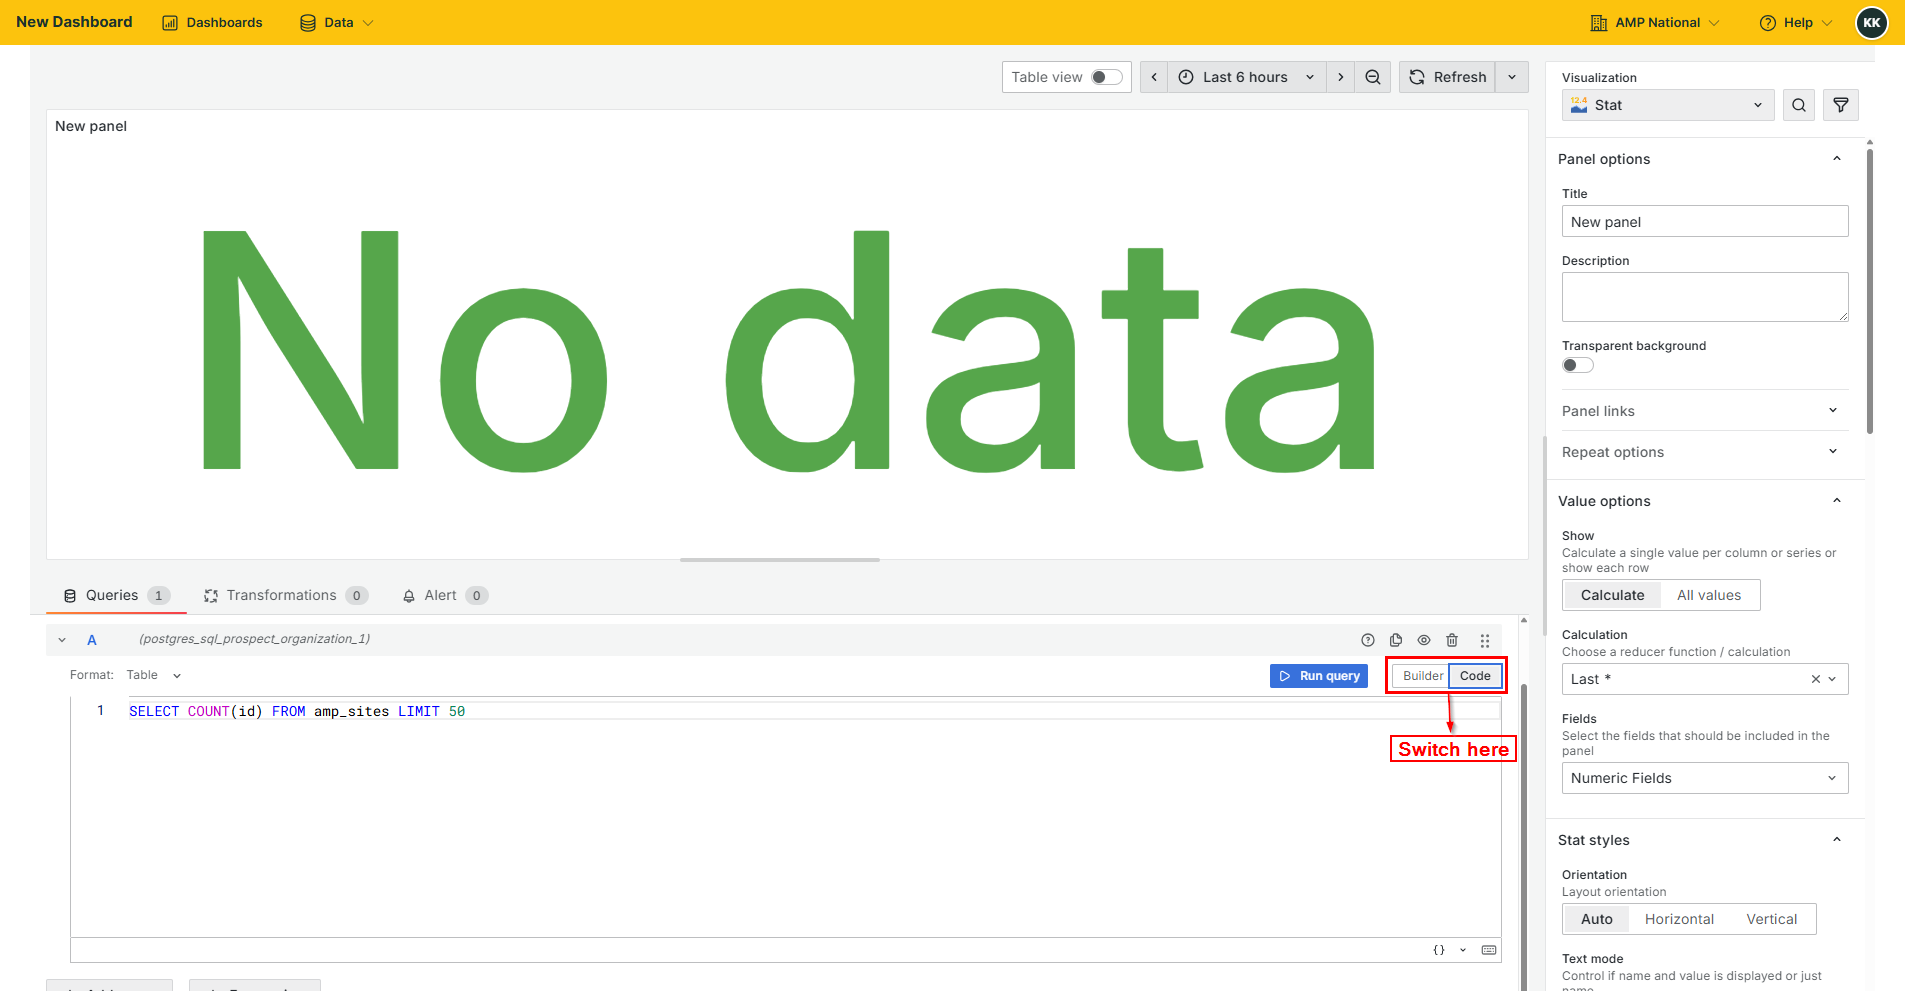
Note
You can also write SQL code to perform the data operation by switching from Builder to Code.
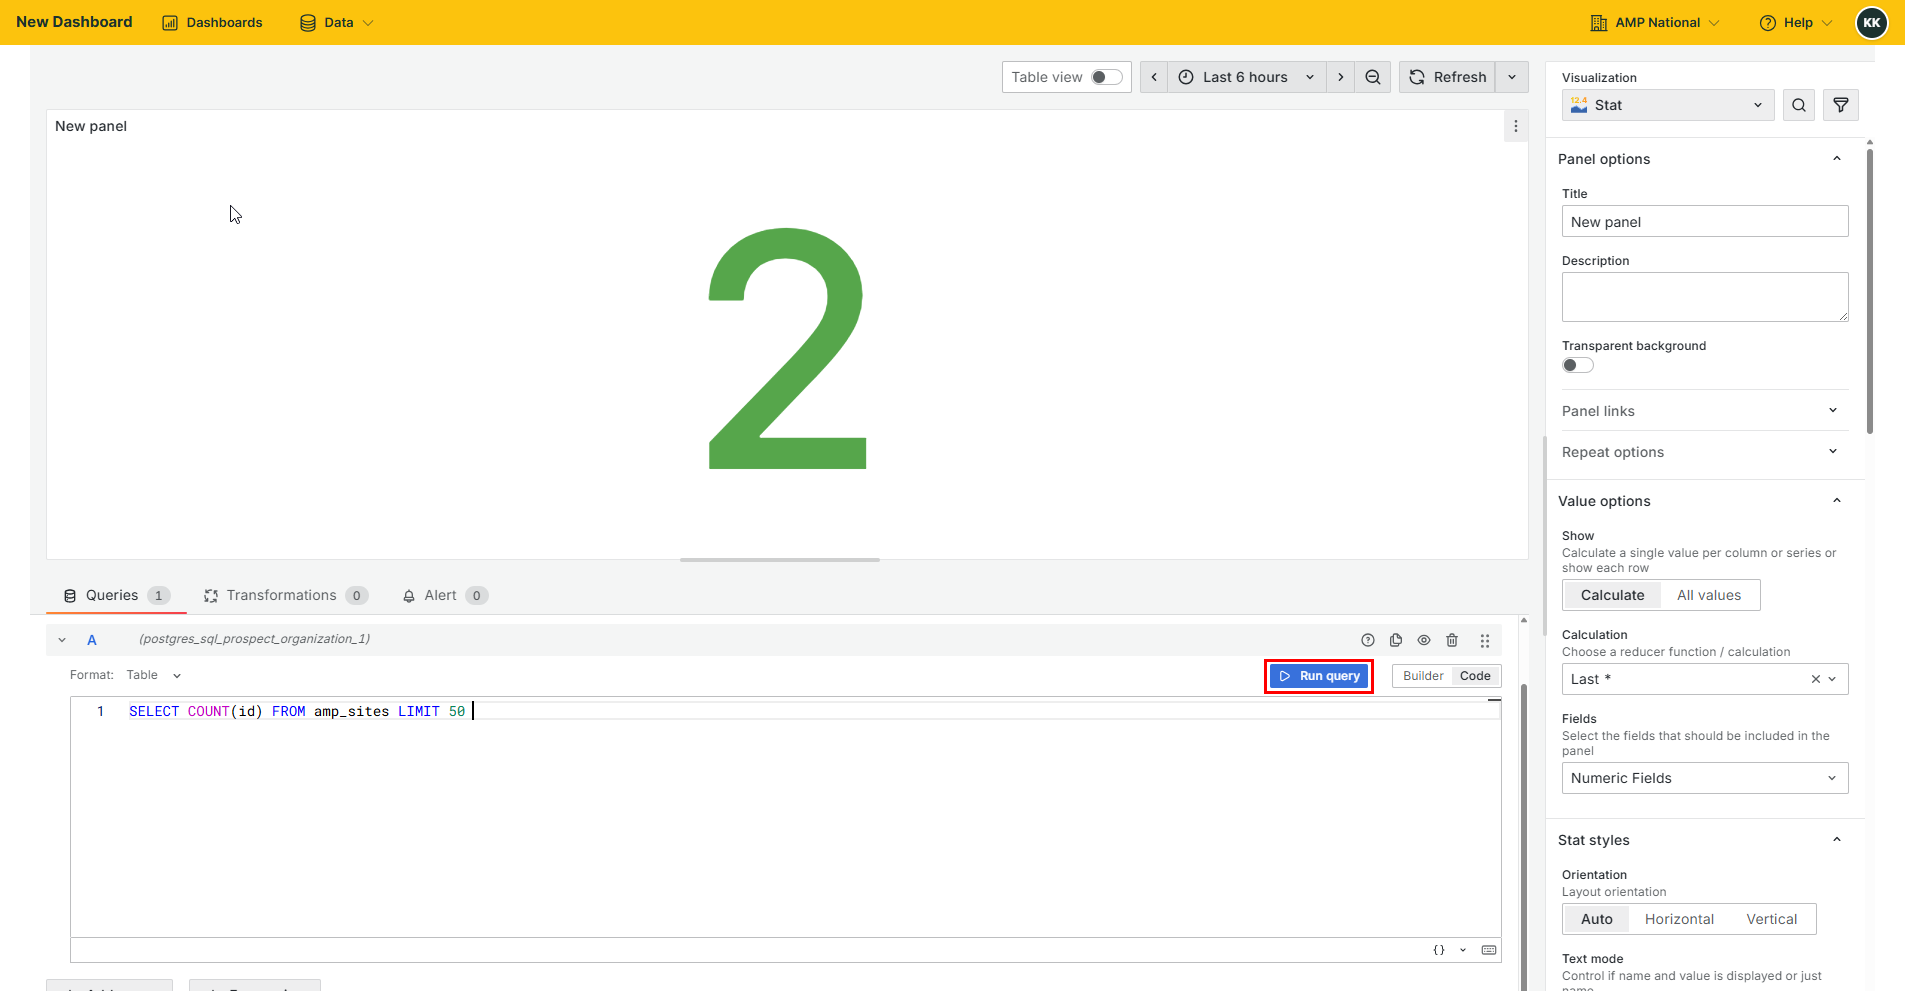
Click
Run Queryto create the visualization.
Click
Save dashboardto save the visualization.
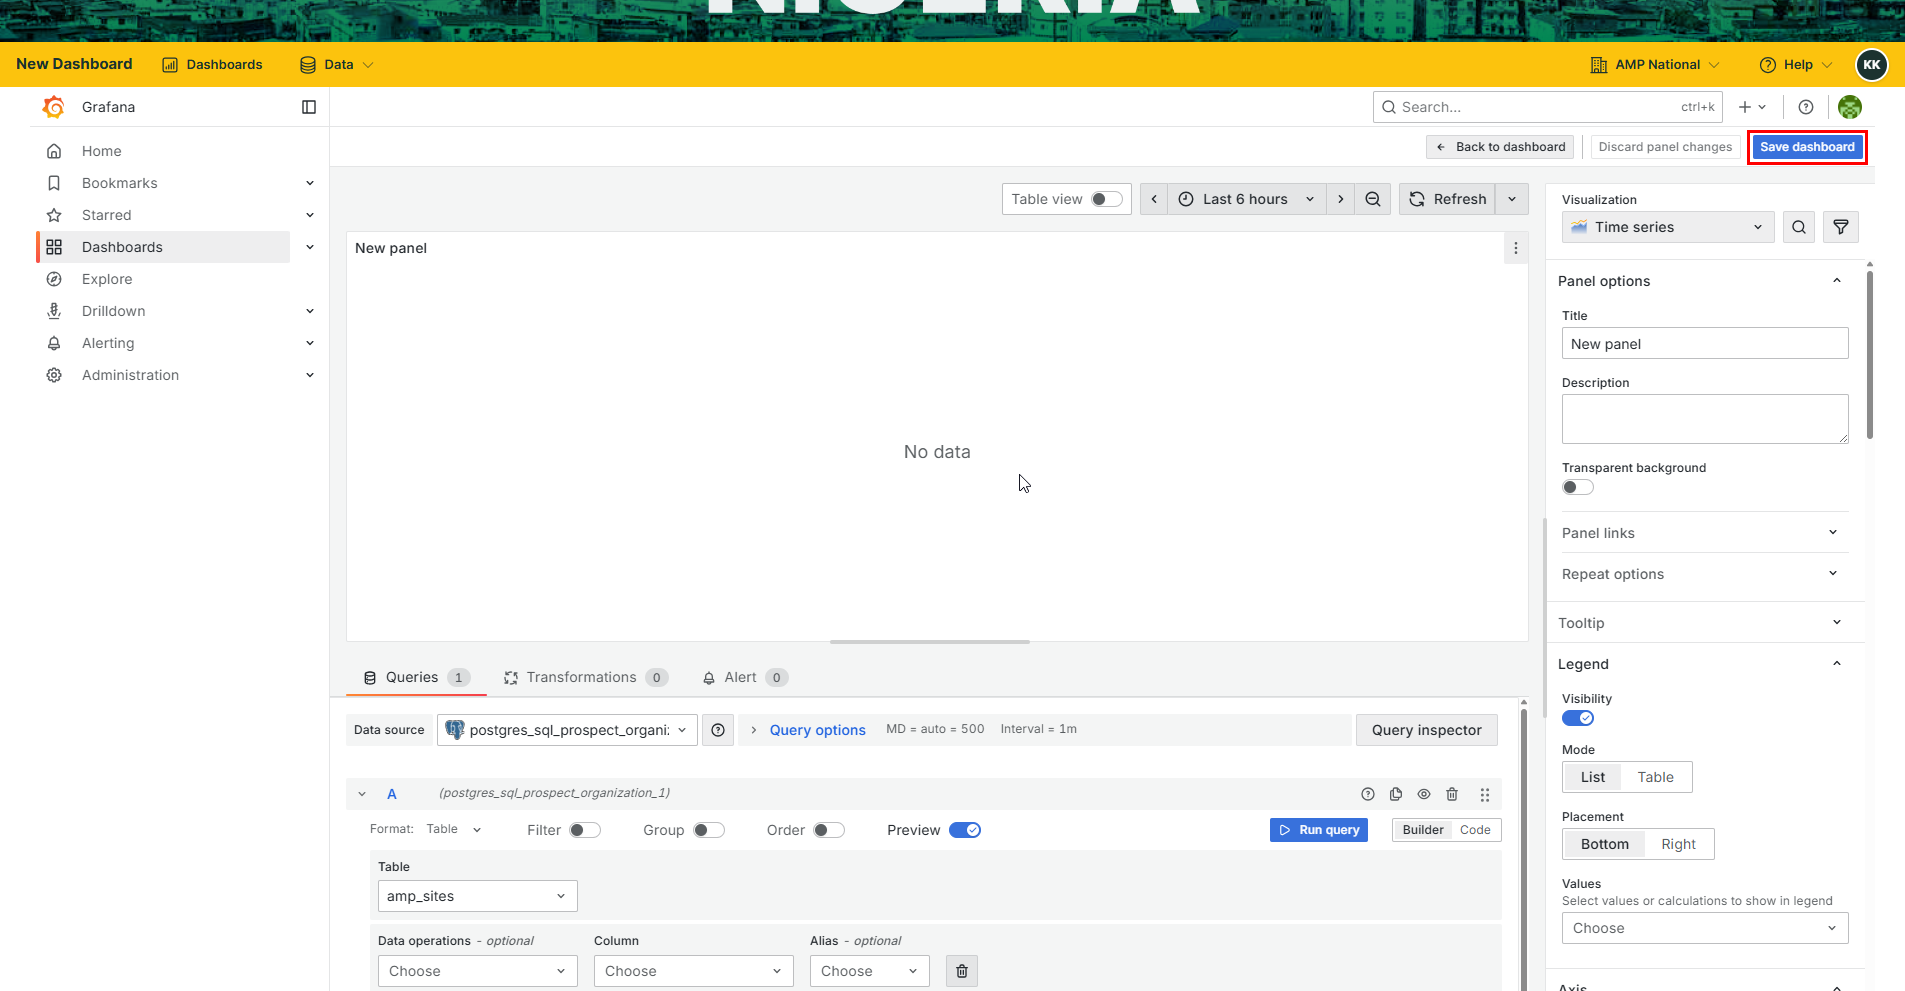
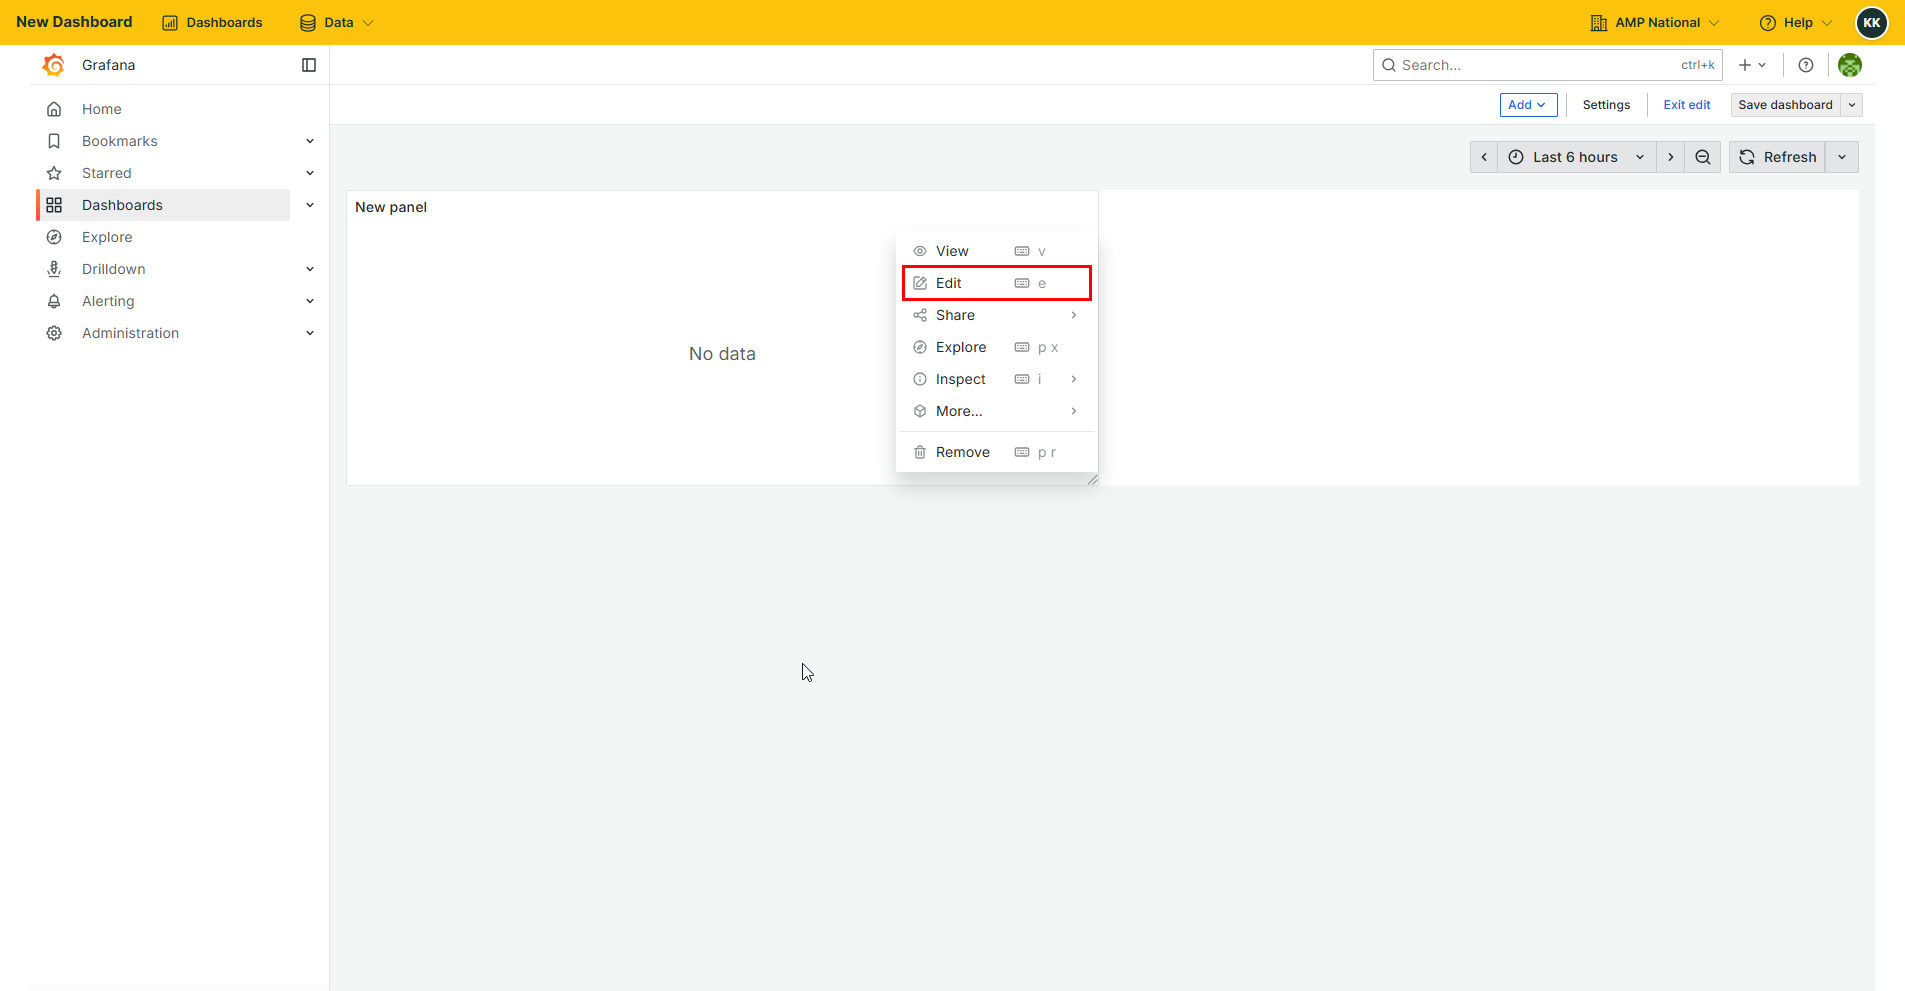
Note
If the Save dashboard button is not visible, press the Esc or Escape button on your keyboard to show more dashboard controls. If you are redirected to a dashboard page, click the Esc button again, then click the menu button on the current visualization then select Edit to go back to editting the visualization
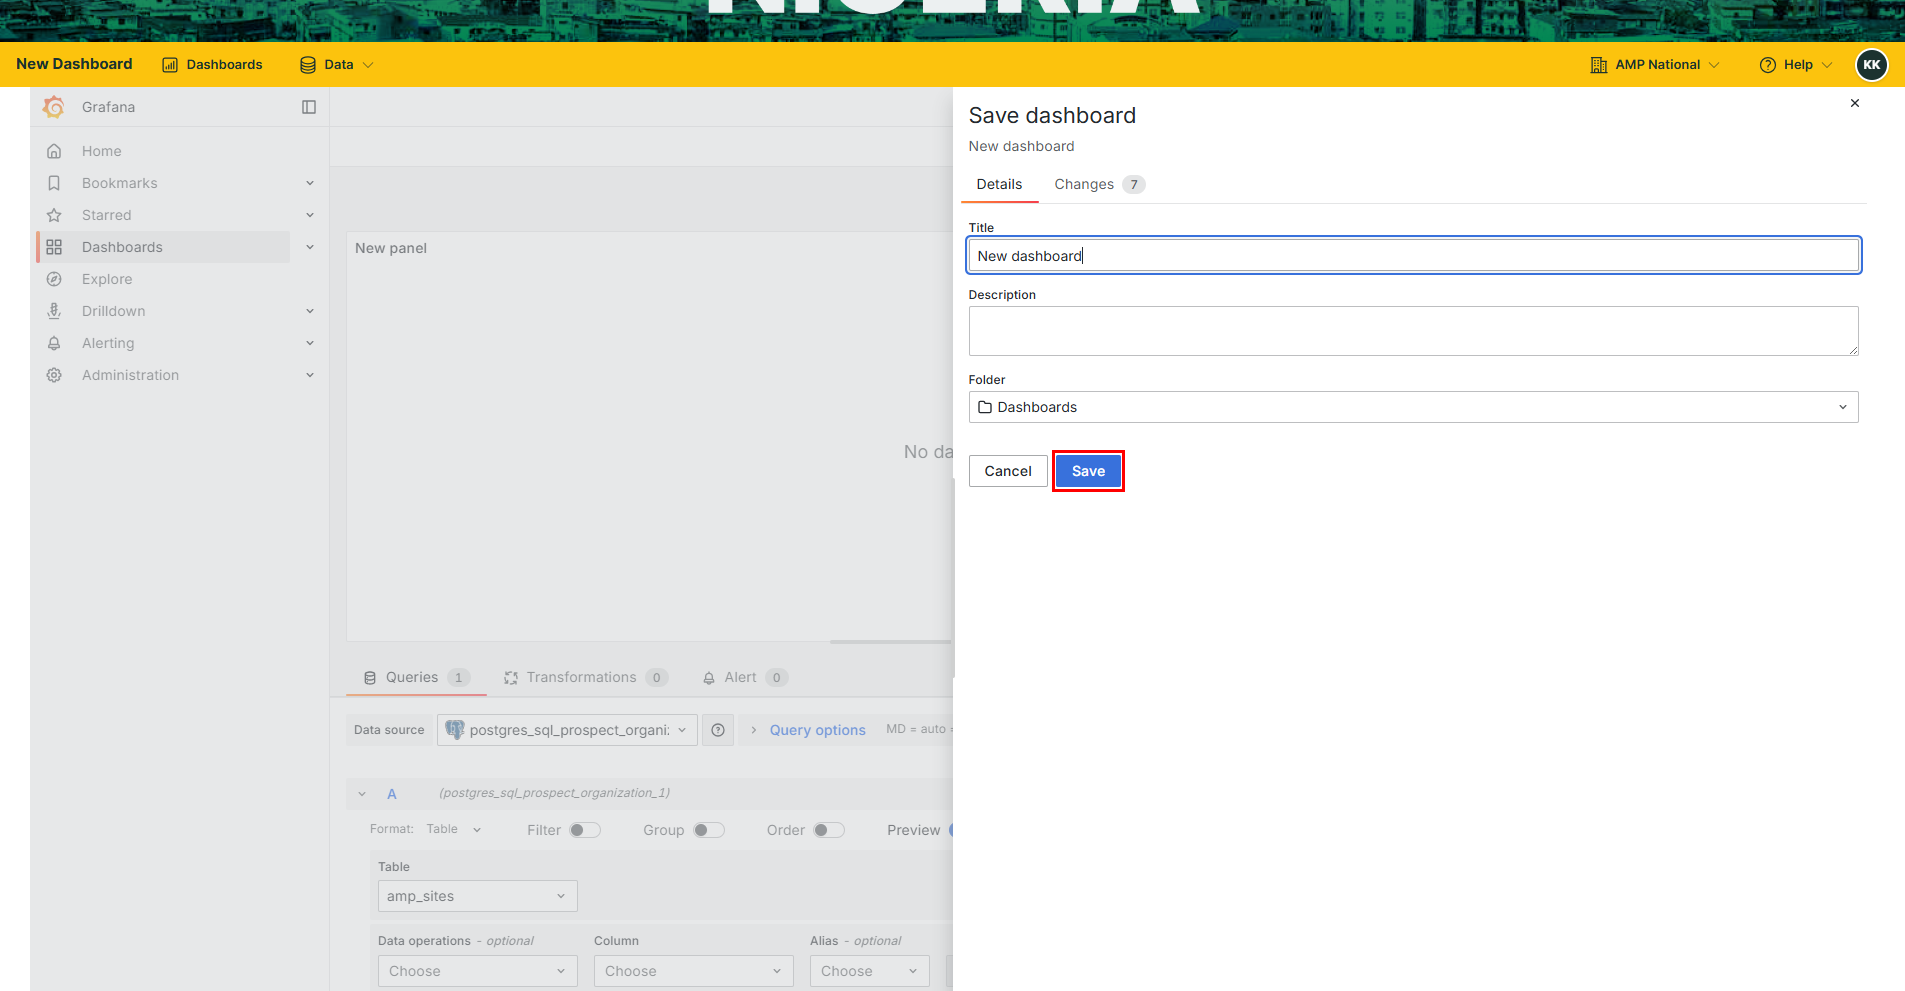
Provide the details of the dashboard that you are creating and click
Save.
Hint
A complete dashboard is made up of more than one visualization. To add a visualization, follow this procedure.
On the current visualization, click
Back to dashboard.

Note
If the Back to dashboard button is not visible, press the Esc or Escape button on your keyboard to show more dashboard controls.
Click
Addand selectVisualization.
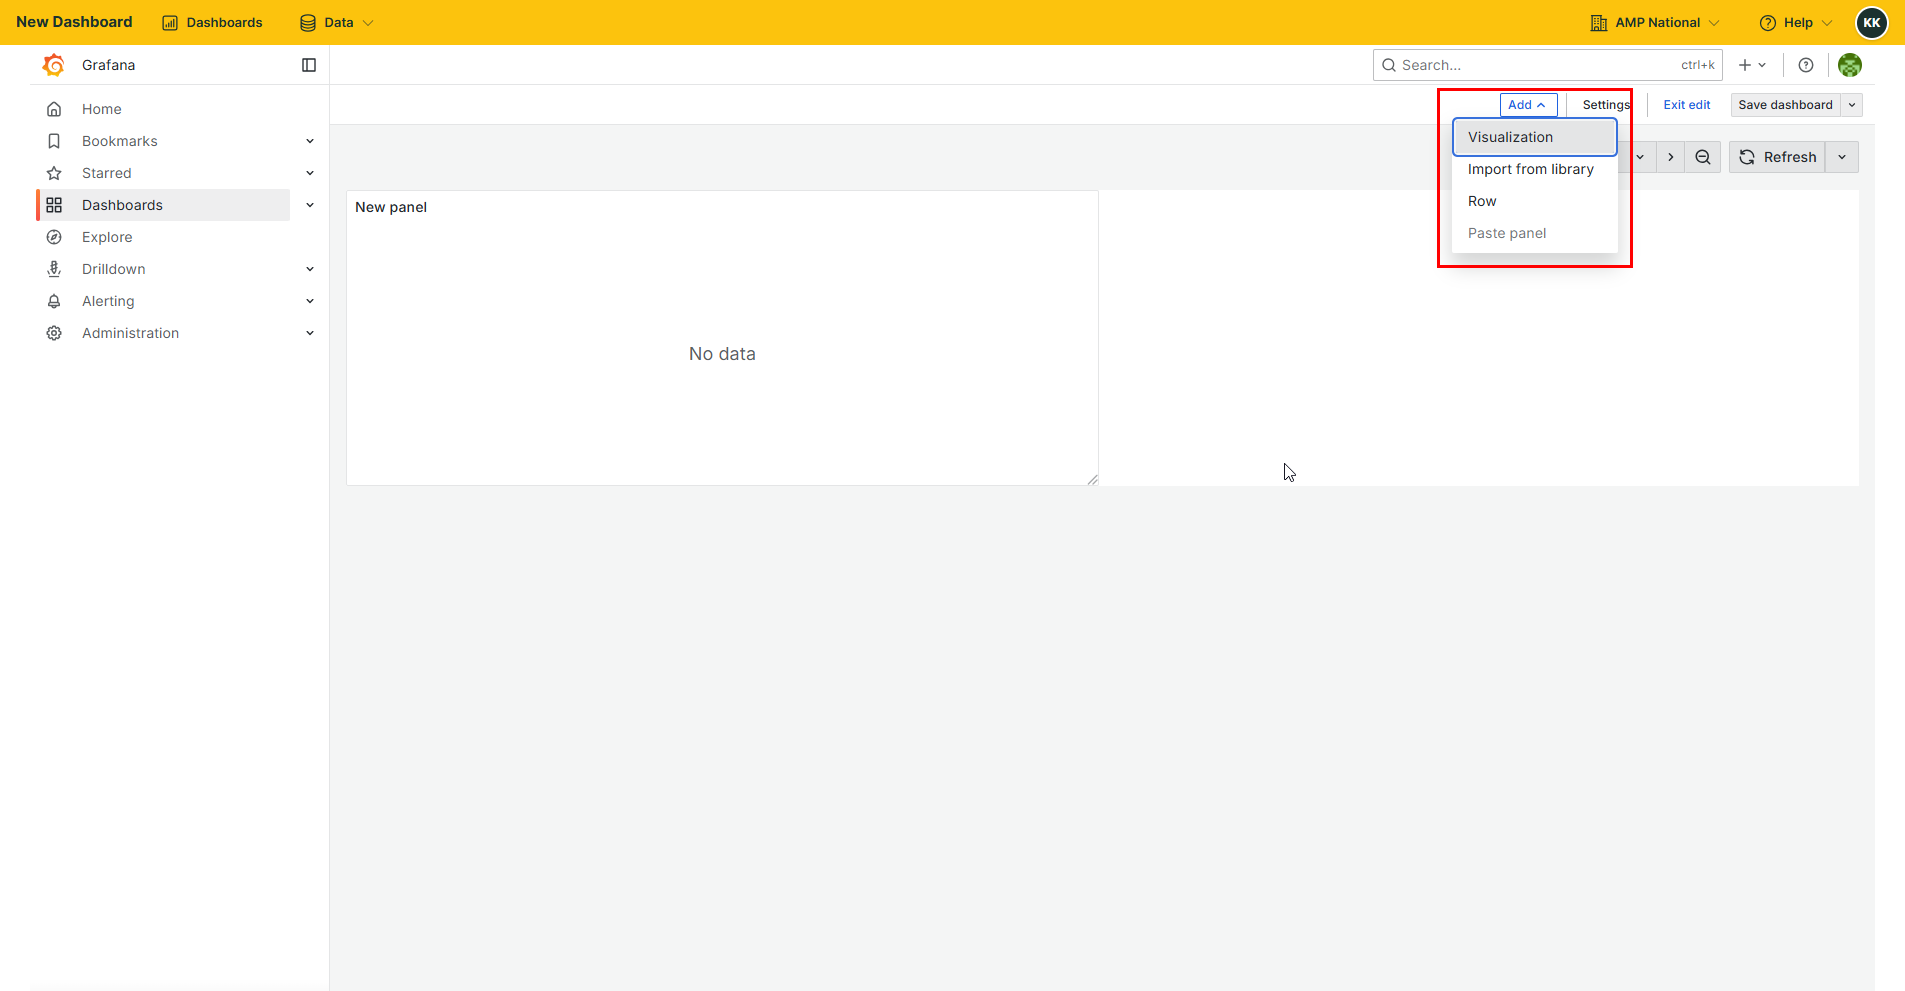
Repeat process 4 to 10.
You can add as many visualizations as required in the dashboard
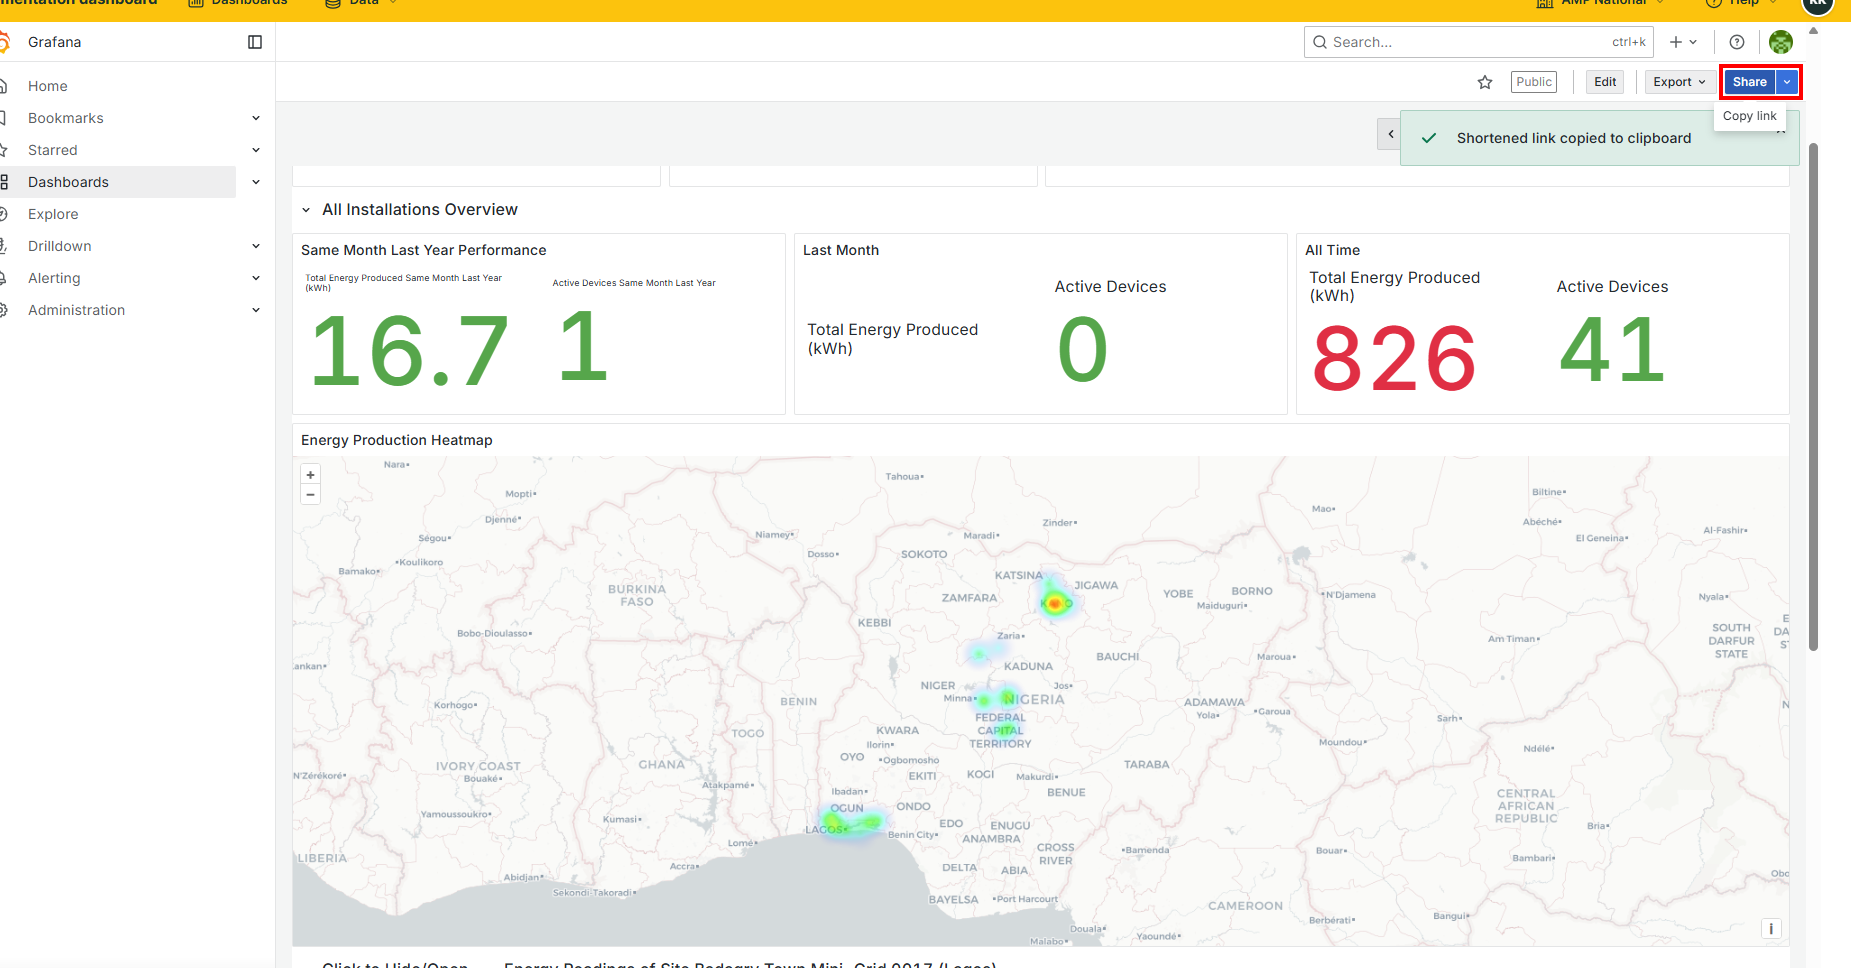
Sharing a dashboard#
On the home page, click
Dashboardsto open the analytics page.
Select the dashboard that you wish to share.
Click the
 to get a shareable link.