QAMF Indicators#
Click
QAMF Indicatorsto open the QAMF Dashboard of Indicators.

On the Dashboard of Indicators, you can:
Toggle categories by changing the QAMF categories
Compare countries by selecting the countries to compare
View historical evolution by clicking the
Evolutionbutton
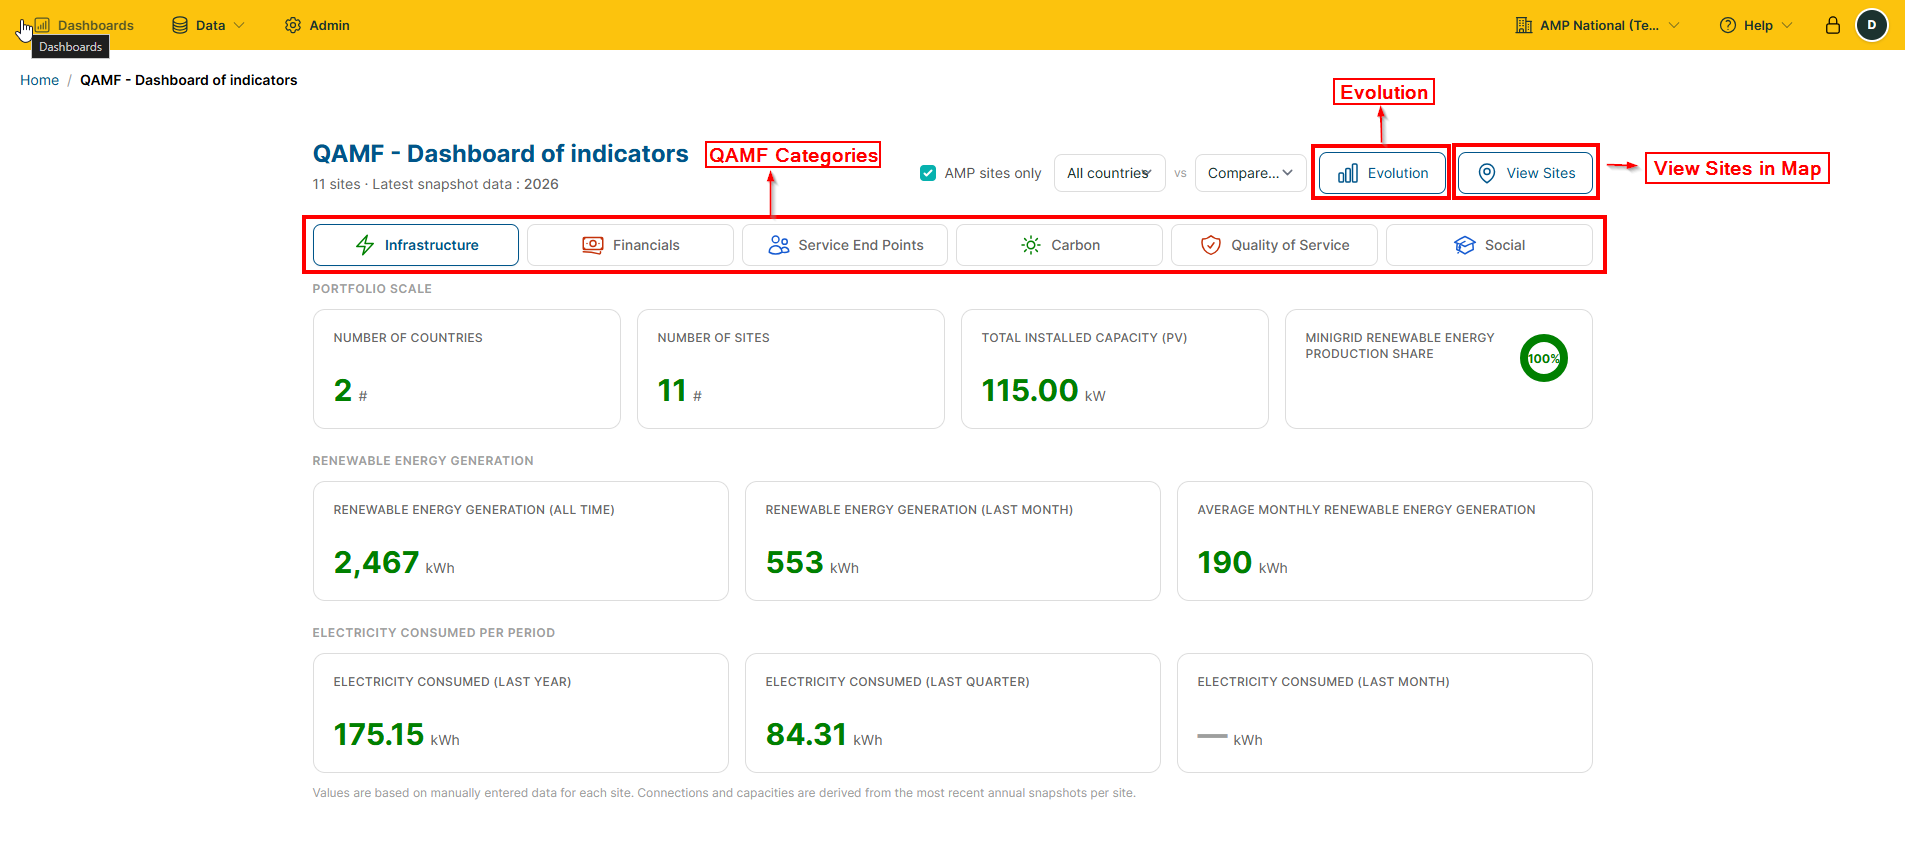
QAMF Categories
Category |
Meaning |
|---|---|
Infrastructure |
Infrastructure and their performance |
Financials |
Financial indicators |
Service End Points |
People and zones served |
Carbon |
Carbon Emissions |
Quality of Service |
System performance |
Social |
Social Impact of the project |
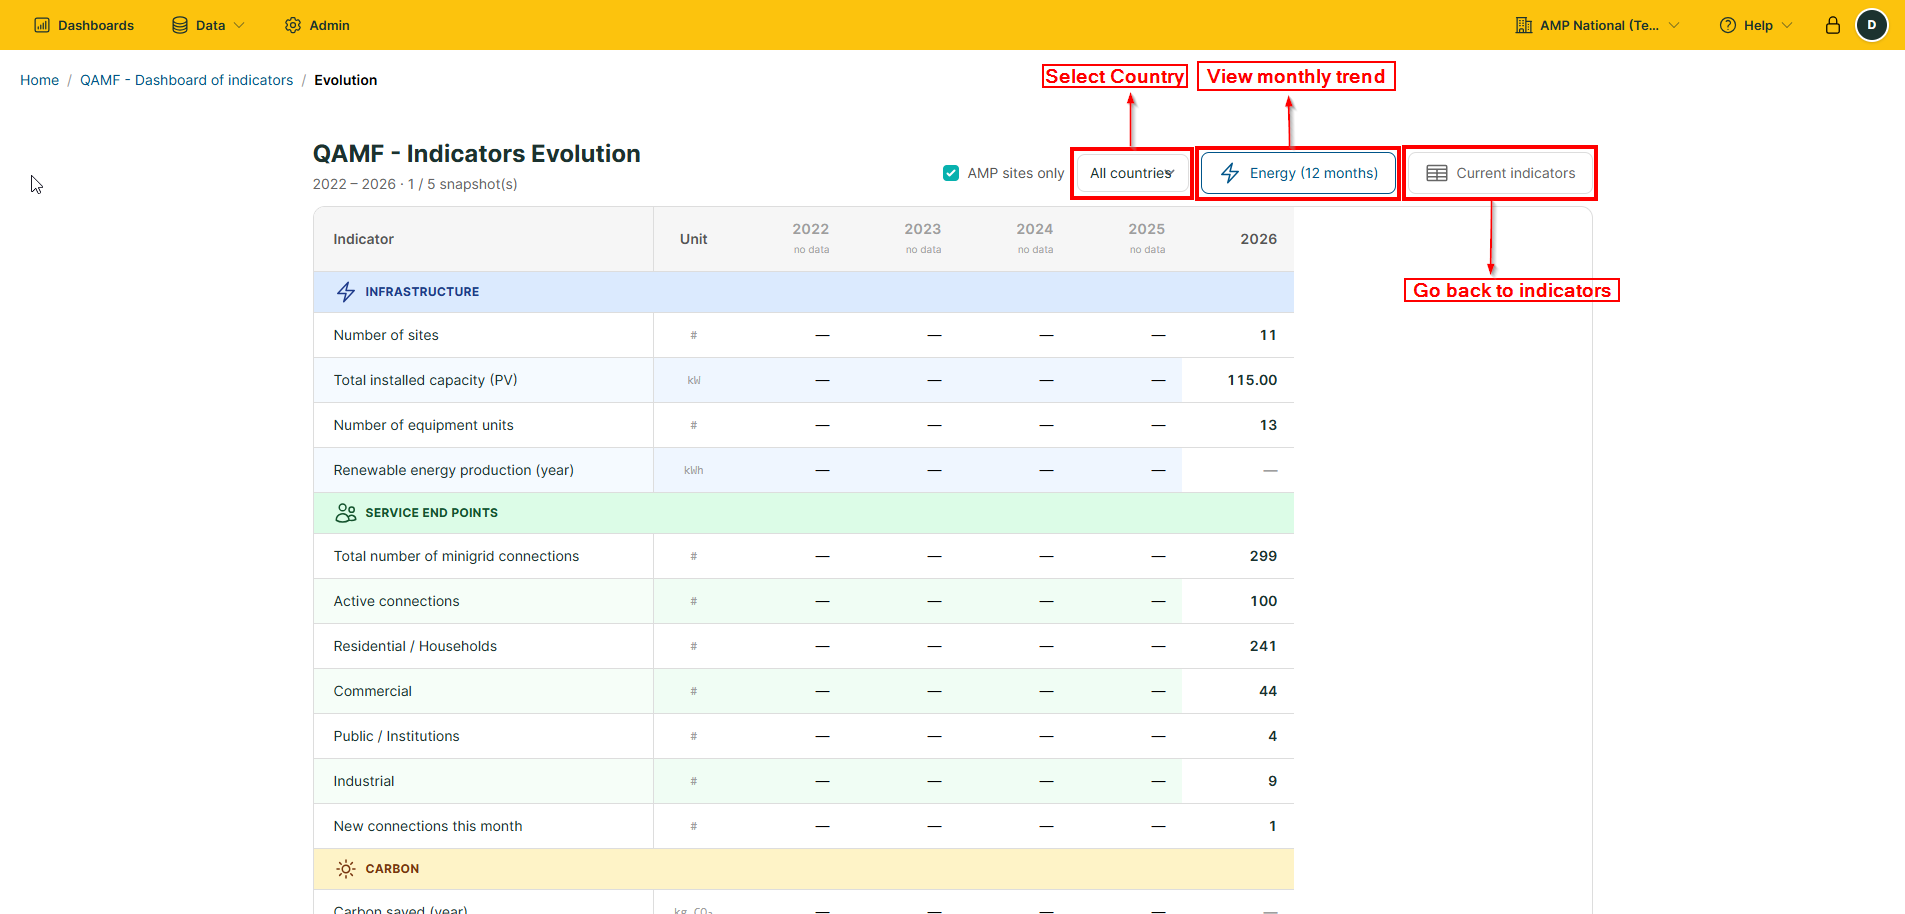
On clicking the
Evolutionbutton, you will be redirected to the QAMF trends page, where you can:
View monthly trends by clicking the
Energy (12 months)button.Select a specific country to see country-specific information
Go back to the
Dashboard of Indicatorspage by clickingCurrent Indicators.